Hello Traders,
In this article we are going to explain what the RSI indicator and its use in analyzing various financial instruments in relation to their price momentum. Firstly, the initials RSI means Relative Strength Index. The index has been introduced in 1978 and measures the strength or weakness of the price momentum in financial instruments. It calculates the speed and magnitude of price changes with an equilibrium level of 50. This means that any level from 0 to 50 could potentially be considered weakness while any levels above 50 to 100 could be considered as strength.
The RSI could be used as one of the multiple analysis tools that we might use to get some data in terms of understanding market price momentum, identify possible market trend shifts, or trend continuation structures.
There is an element of misconception amongst the industry that an RSI reading below 30 or above 70 equals to oversold or overbought market conditions which in certain cases might be accurate but in many more not. As an example a RSI above 70 might be indication a strong bullish momentum and could indicate that any dips or pullbacks in such market conditions may remain supported with buyers pushing prices higher and vice versa for sellers if the RSI is below 30.
Let’s have a look at a recent example from EURUSD from last month’s up trend in the 4-hour time frame using the RSI:
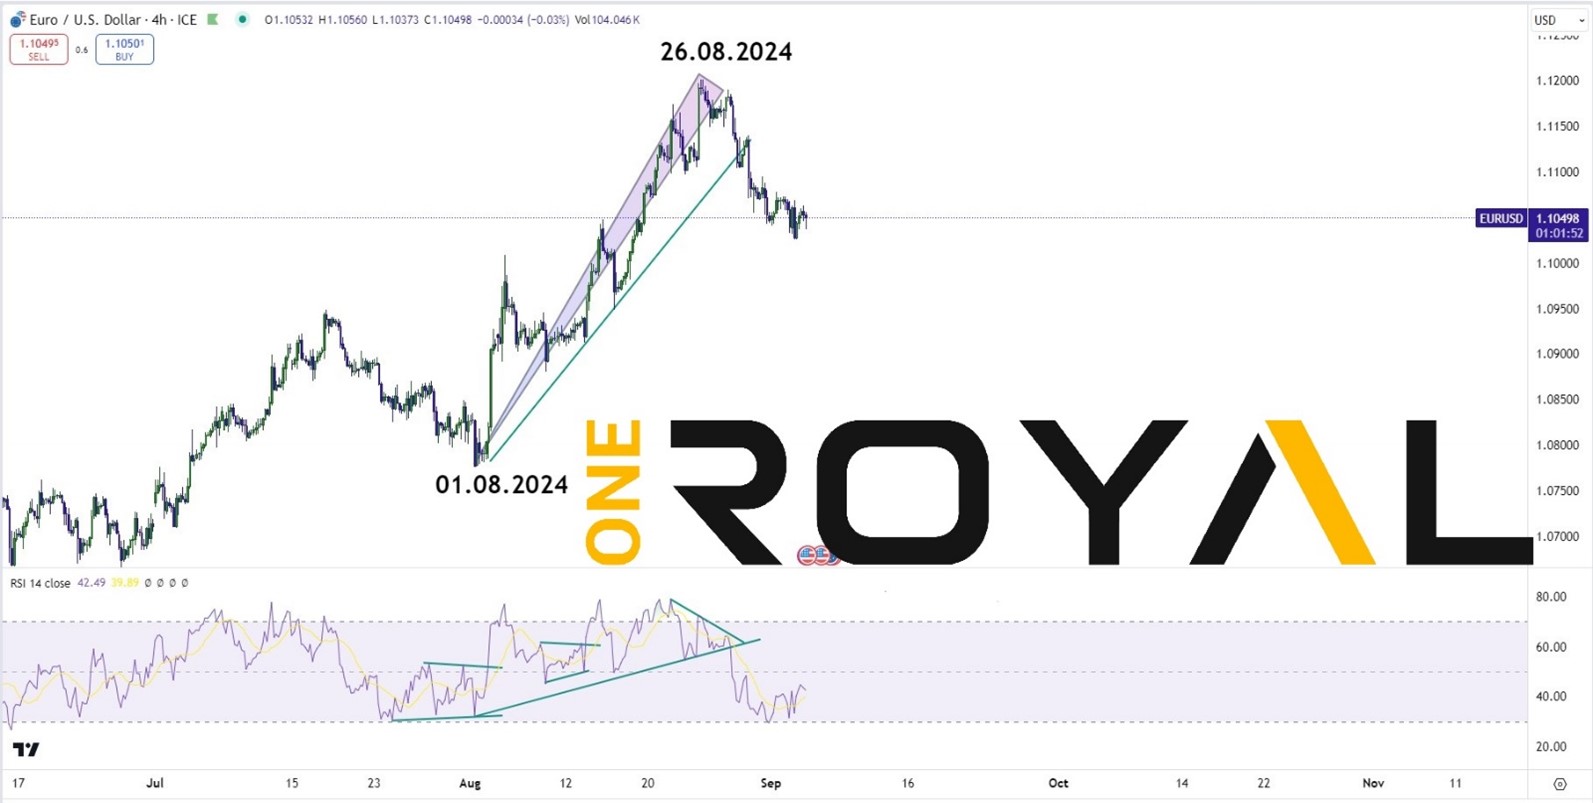
As we can see we had an uptrend rally from 01.08.2024 to 26.08.2024 and the market went from the 1.07760 area towards the 1.12000 area. As we can observe from the RSI window indicator at the bottom of the chart, we can see that it had created an accumulation channel which has been broken to the upside with the RSI reading reaching extremes around the 75-80 area which there after has generated a pullback and then it remain supported for more upside with another accumulation channel and the RSI remaining above the level of 50. The uptrend has shifted only when the RSI gave a weakness signal once a momentum divergence has been observed in the last push up when the new high in price came in with a new low in RSI with confirmation provided only when the RSI indicator has broken below the generated RSI trendline as drawn in the chart which the RSI has acted as a leading indicator before the price broker the trendline drawn I the chart.
In Conclusion for this this article, we wanted to showcase how using the RSI with the default industry misconception proves to be an unreliable way of using it and how it has reacted in this specific uptrend in the EURUSD last month. It’s also crucial to understand that using the RSI indicator alone does not guarantee 100% accuracy neither price momentum forecasts all the time and understanding market risks is key before deciding to execute any trading positions and risk management remains crucial in all traders trading decisions. In this example we have seen how it has helped us to determine the strong uptrend in EURUSD last month.
Stay tuned for more educational content and market analysis and updates from us and remember to follow us throughout our social media channels. If you are new here and you are looking to get your trading account, you can register at: https://www.oneroyal.com/en/
Risk Disclaimer: The information provided on this page, including market analysis, forecasts, and opinions, is for informational purposes only and does not constitute investment advice or a recommendation to buy or sell any financial instruments. Investing in financial instruments involves significant risk, including the potential loss of the principal amount invested. Leveraged products, such as CFDs and forex, carry a high level of risk and may not be suitable for all investors. Past performance is not indicative of future results. You should conduct your own research and consult with a qualified financial advisor before making any investment decisions. The firm does not guarantee the accuracy or completeness of the information provided and shall not be liable for any losses or damages arising from reliance on this content. By using this page, you acknowledge and accept these risks.