Hello Traders,
In this trading educational article we will explain the Trend based Fibonacci Extension tool and how it could be used in trending market conditions in finding potential reaction levels. We will be looking at 2 examples using GBPUSD explaining the sequence and cycle swings.
What is The Trend-Based Fibonacci?
Trend-Based Fibonacci extensions are a technical analysis tool based on the Fibonacci sequence, used to identify potential support and resistance levels after a price trend. They differ from standard Fibonacci retracements by using three points instead of two, allowing for more dynamic predictions.
In order to use the tool we first need to determine a market trend in which we will then need to have 3 points. In case of a bullish market trend, these points should include a swing cycle top followed by the first point low and lastly with a confirmed third point which will be the top of the connector corrective bounce top. By having these 3 points in place, applying the trend-based Fibonacci extension tool will provide us by default with 3 Fibonacci levels.
The 3 Fibonacci Levels:
- 100% (1)
- 123.6% (1.236)
- 161.8% (1.618)
The 3 levels are considered to be a market’s extreme areas in which we might be expecting to see a reaction from the market.
It’s important to note that this is not a definitive way in finding 100% of the times potential reaction levels and it does not work 100% of the time as with anything else in the markets and trading. It is a useful tool amongst others that can be utilized to help traders identifying such areas.
GBPUSD 4HR Example 1 – Cases In Which The Trend Based Fibonacci Extension Tool Provided The Buying Area For The Pair
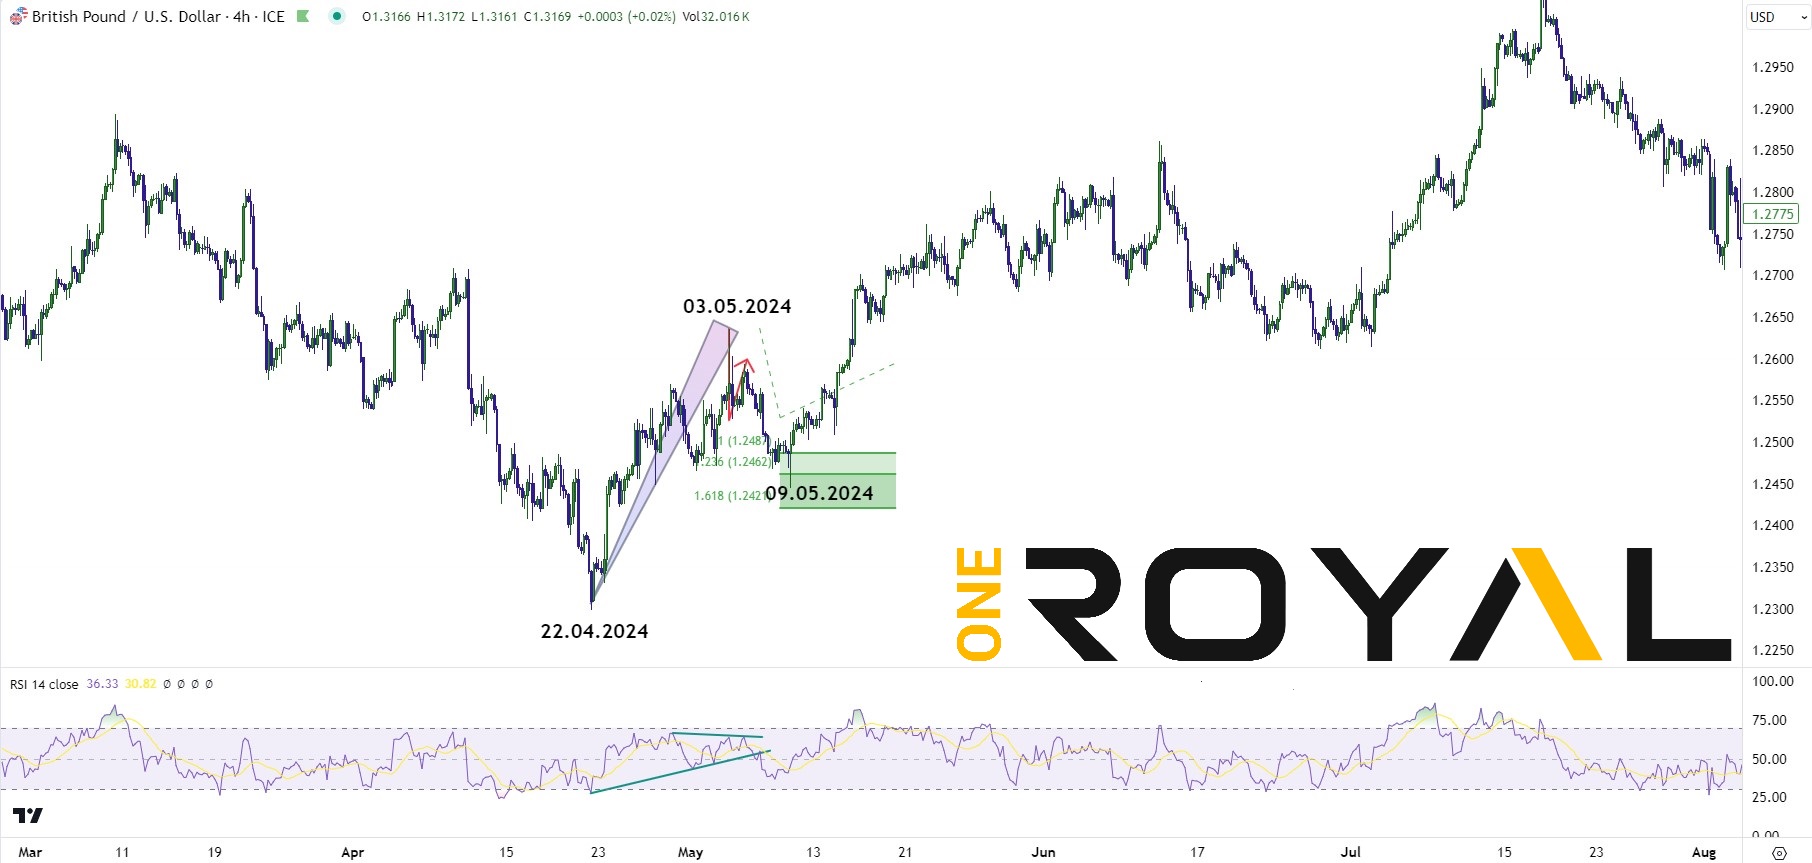
We can see that from 22.04.2024 low the market has reacted higher and ended the swing on 03.05.2024 which then within a breakdown from the RSI trend channel we had establish the first move down followed by a bounce which failed to produce another high thus allowing us to place our trend-based Fibonacci extension toll using the 3 levels and generate the 3 level extension in which we can see that the price has reached and then provided support with a low on 09.05.2024 and reacted higher to allow the trend to resume.
Example 2
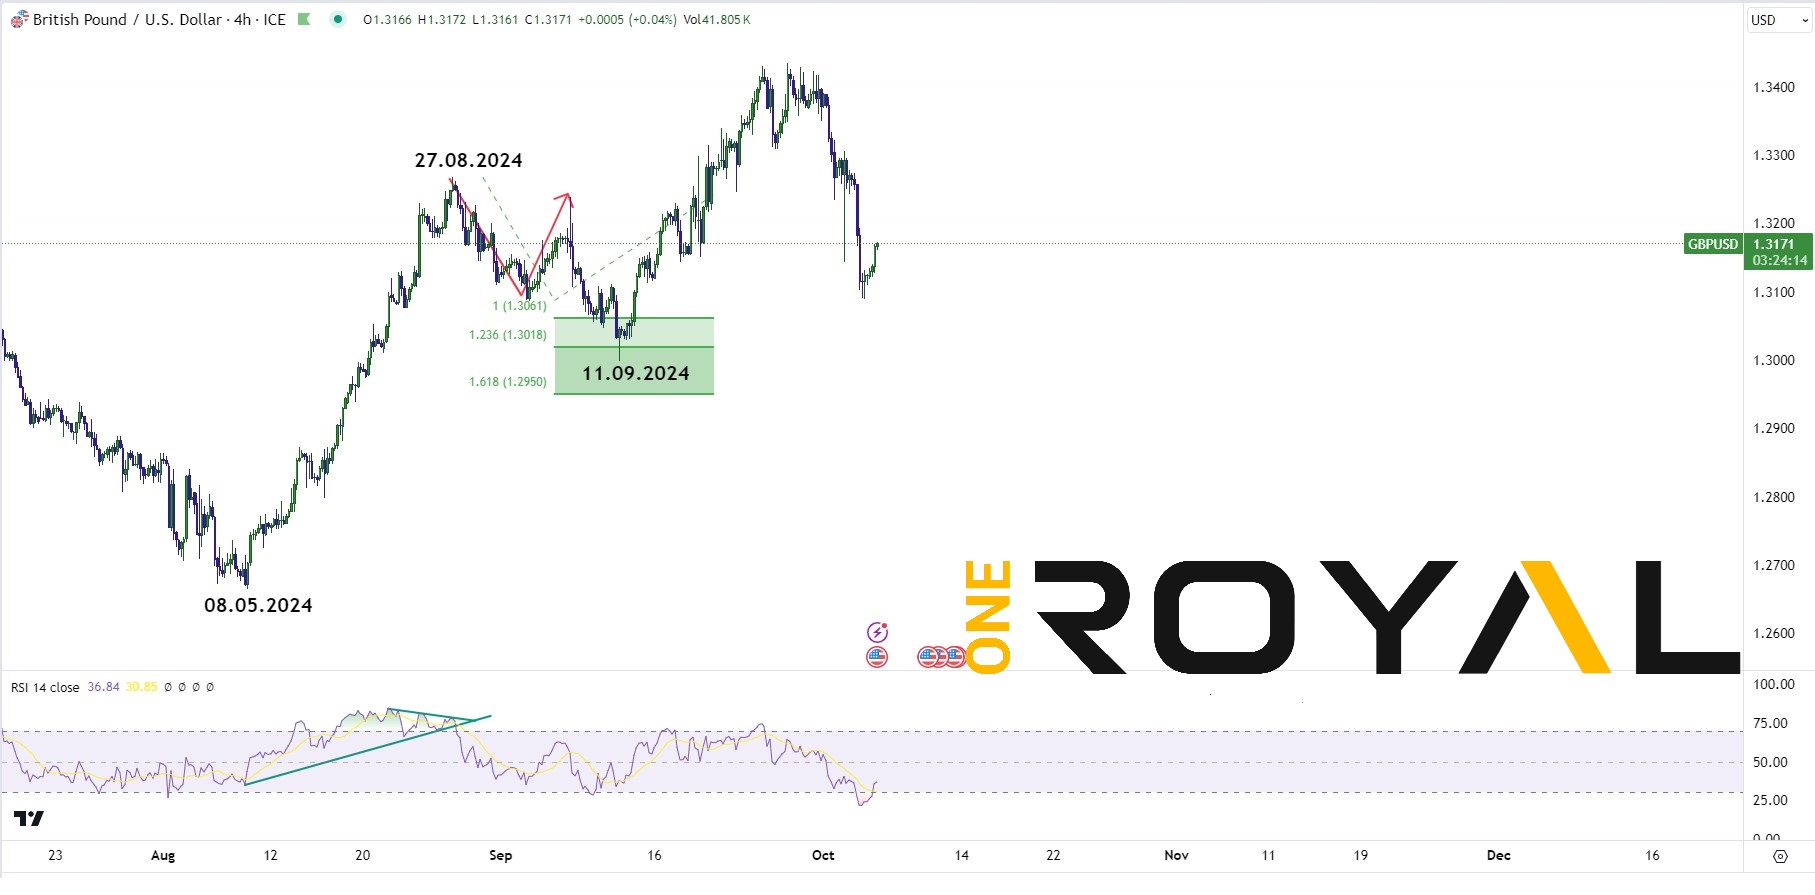
Same idea in this example as well, as the move that started on 08.05.2024 ended on 27.08.2024 and then followed by a lower high, it generated another Fibonacci extension area which was reach and created a low on 11.09.2024 within the 100% – 161.8% and then it resumed the bullish trend.
The same way the trend-based Fibonacci extension tool can be used for bearish market trends for the opposite direction and the principle and idea should be identical to the 2 example we have showcased above. Once again it’s important to understand that: this is not a definitive way in finding 100% of the times potential reaction levels and it does not work 100% of the time as with anything else in the markets and trading. It is a useful tool amongst others that can be utilized to help traders identifying such areas.
Hopefully you have found this educational article useful and helpful and add another tool amongst your trading tools. If you are new here and you do not already have a trading account you can sign up at: https://www.oneroyal.com/en/
Risk Disclaimer: The information provided on this page, including market analysis, forecasts, and opinions, is for informational purposes only and does not constitute investment advice or a recommendation to buy or sell any financial instruments. Investing in financial instruments involves significant risk, including the potential loss of the principal amount invested. Leveraged products, such as CFDs and forex, carry a high level of risk and may not be suitable for all investors. Past performance is not indicative of future results. You should conduct your own research and consult with a qualified financial advisor before making any investment decisions. The firm does not guarantee the accuracy or completeness of the information provided and shall not be liable for any losses or damages arising from reliance on this content. By using this page, you acknowledge and accept these risks.