Hello Traders,
As the Black Friday and US public holiday of Thanksgiving it’s just around the corner in the next 2 weeks on Friday November 29th, in this article we be explaining whether this has any impact in the financial markets and if so which sectors or markets we might expect to be affected. As it is well known, Black Friday and the following Cyber Monday are days in which any level of shops both physical or online offer big bargains and offers in various products or services. In addition to that, this year black Friday takes place on November the 29th in which it is also Thanksgiving day in US.
It is assumed that the potential impact of a higher number of sales during this period of time could affect the stock market prices of companies such as Amazon, Walmart, eBay, Alibaba, Netflix & others which they tend to have increased sales activities during this time. But is this always the case? The simple answer is no. In general, any potential impact from this sales, holiday period might impact prices in the short term, however the events themselves do not impact in reality.
The main importance for market prices to potentially rise it needs to be a combination of higher net sales with good economic data in consumer confidence. What drives consumer confidence levels include changes in housing costs, unemployment rates and inflation. In simple terms, if the overall economic data is healthy and positive, consumers should be having more confidence and thus increase their spending potential. On the other hand, if unemployment rates are higher with higher inflation rates, consumers tend to be more pessimistic and defensive in their spending, despite of Black Friday.
Impact of Q3 Earnings
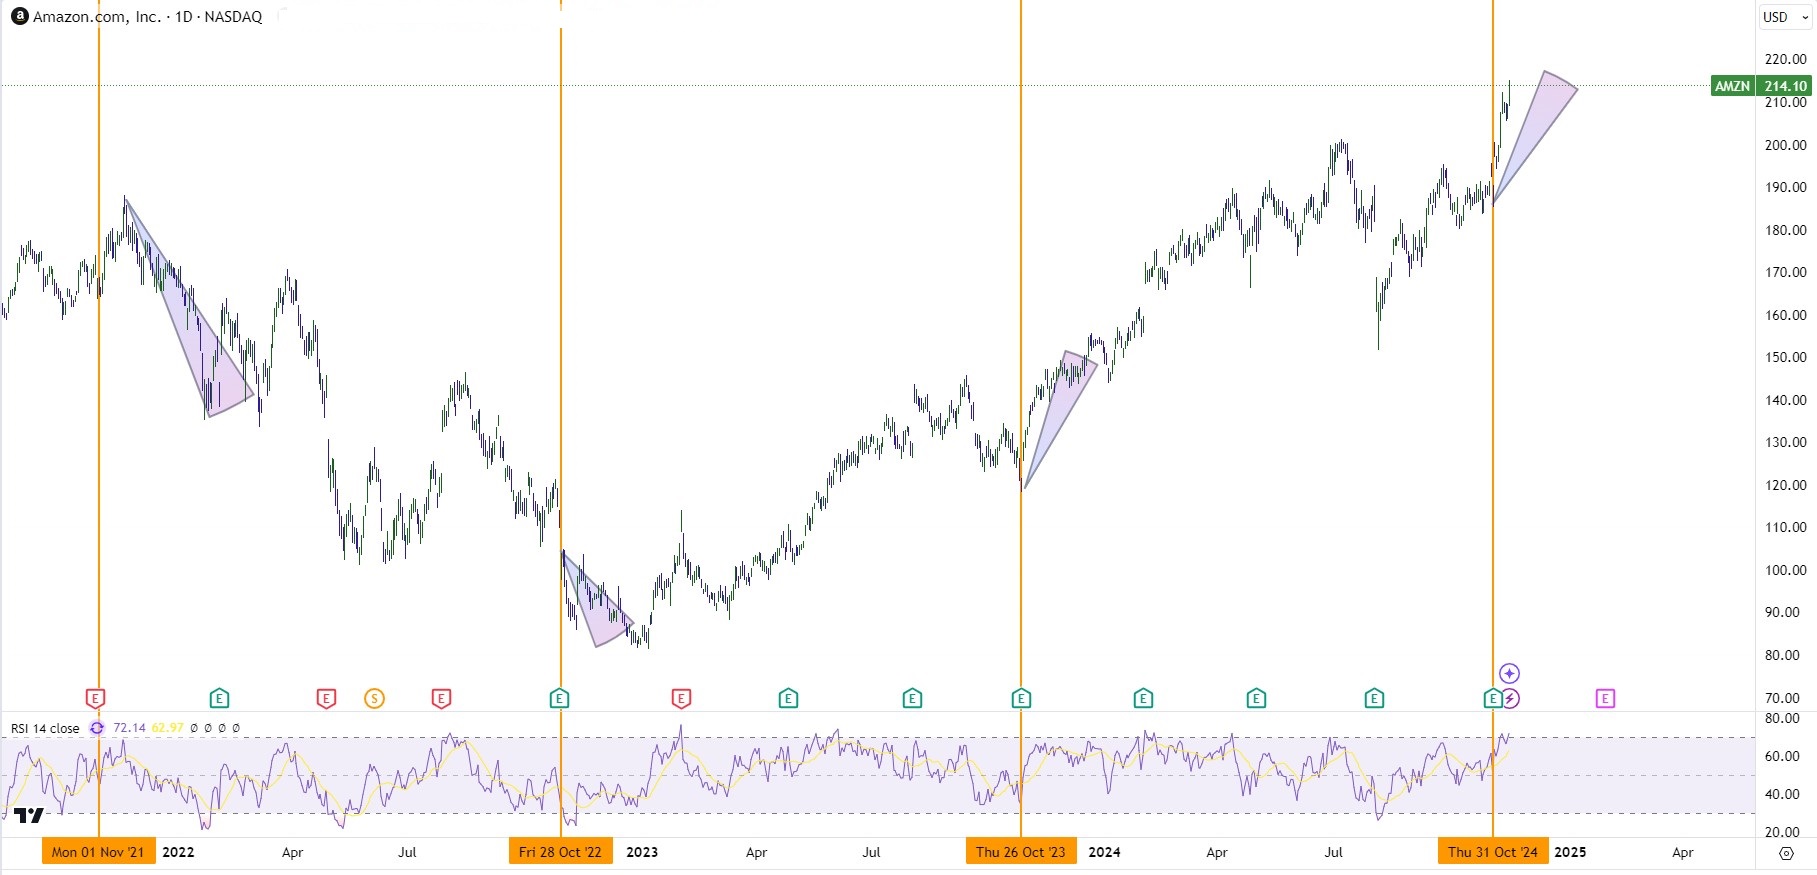
It has to be noted the fact of each company’s Q3 earnings report which it is announce a month prior to Black Friday might potentially provide with clues that the company’s sales are doing well and likely to maintain a positive momentum leading into the Black Friday sales period. We would see below an example with Amazon and eBay and relate to this data.

The yellow vertical lines represent the time of the Q3 earnings report for Amazon from 2021 until today. We can see that during 2021 with negative earnings report highlighted in red E the share price after a spike has turned lower as well as during 2022 despite positive earnings the market was in a downtrend due to higher interest rates and inflation data. Then for the last 2 years we have seen both positive Q3 earnings highlighted with green E and prices moving higher as there has been overall higher consumer confidence in combination of inflation rates colling down and the expectations of interest rate cuts.
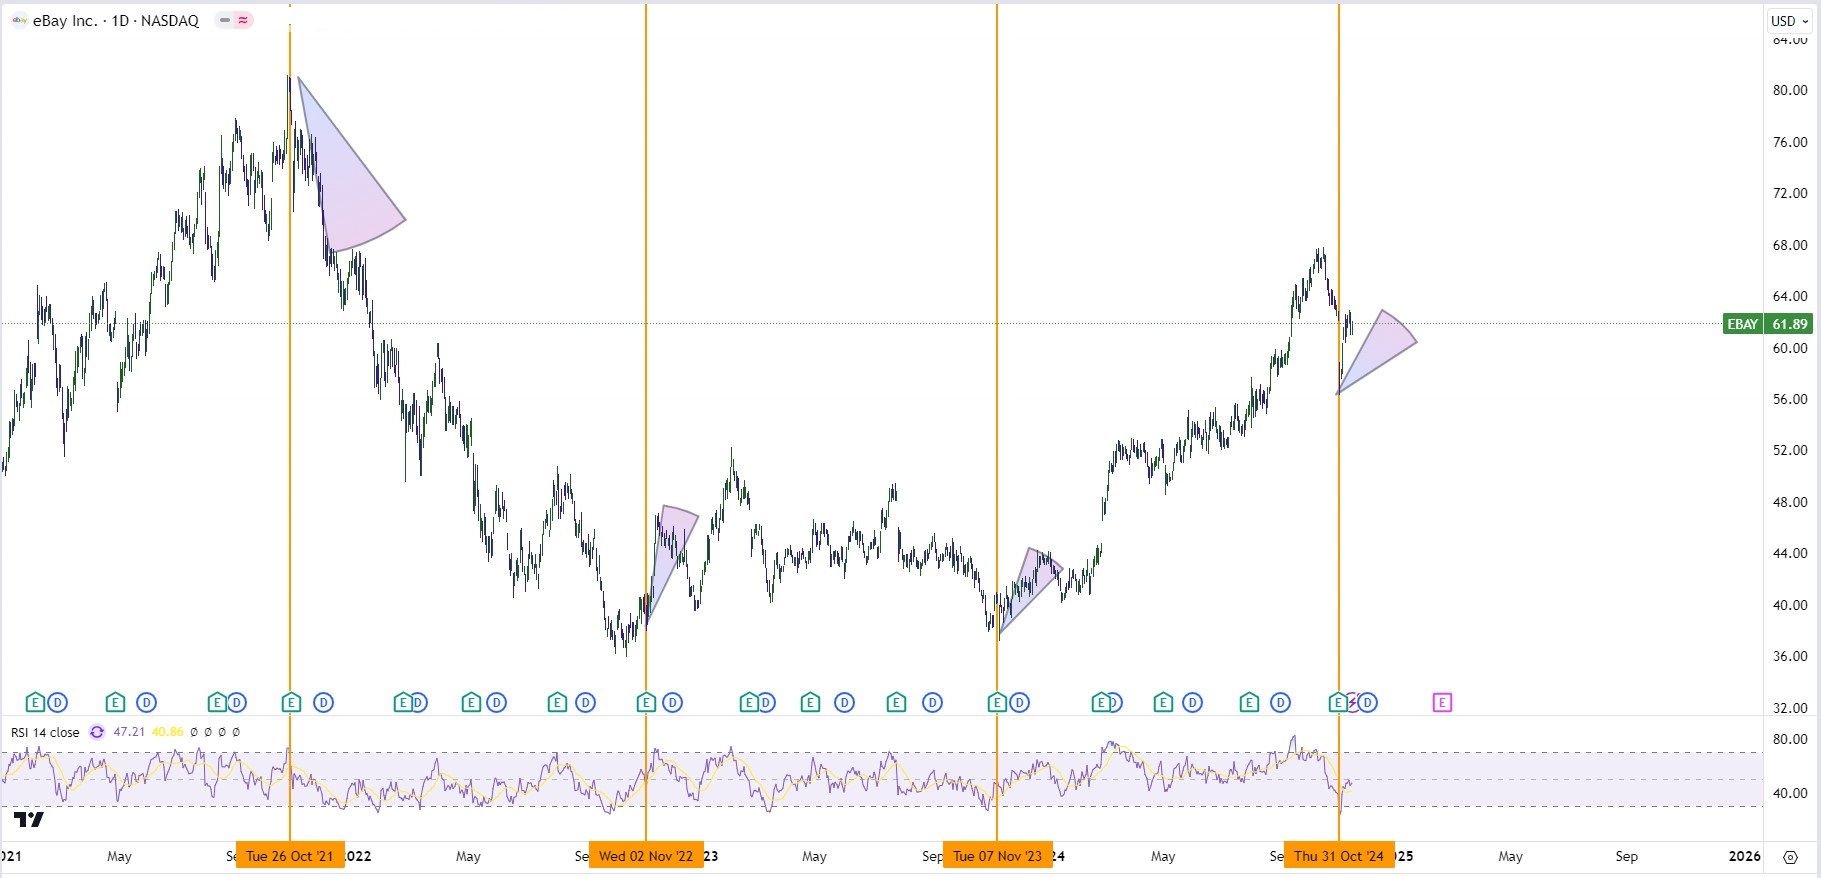
eBay – Q3 Earnings 2021-2024

As we can see with eBay positive Q3 earnings every year from 2021 to today, have resulted in a move to the upside except in 2021 in which we had high levels of inflation and the rising of interest rates which created consequently lower consumer confidence in return.
As the potential market impact during the Black Friday and Cyber Monday days appears to depend mainly on how well the overall economy does and the inflation % with a combination of monetary policy, the potential trading opportunities that stocks like these retail shops and especially online shopping could be something that traders could look to take advantage of in combination of the overall economic data in the specific time and year. Another possible opportunity amongst the markets could be a more risk diverse approach and looking at the US Indices such as the SP500, Nasdaq or the Dow Jones as alternatives which they combine a list of top performing stocks within the US economy.
The impact should be identical to the factors mentioned above such as the overall economy and state of the overall consumer’s confidence at this time, while it might provide a lower risk approach as the % change in those indices could be less volatile than individual companies shares.
If you are new here and you do not already have a trading account you can sign up at: https://www.oneroyal.com/en/
Risk Disclaimer: The information provided on this page, including market analysis, forecasts, and opinions, is for informational purposes only and does not constitute investment advice or a recommendation to buy or sell any financial instruments. Investing in financial instruments involves significant risk, including the potential loss of the principal amount invested. Leveraged products, such as CFDs and forex, carry a high level of risk and may not be suitable for all investors. Past performance is not indicative of future results. You should conduct your own research and consult with a qualified financial advisor before making any investment decisions. The firm does not guarantee the accuracy or completeness of the information provided and shall not be liable for any losses or damages arising from reliance on this content. By using this page, you acknowledge and accept these risks.


